Monday 29 December 2014

SQL Server 2014 Checklist for Performance

SQL Server 2014 Checklist for Performance

Quick Tips
  • Test your changes on your test servers
  • Make changes incrementally - small change at a time
  • Use 64 bit, even on a laptop
Memory
  • Set MIN and MAX values for memory.
  • Enable Optimize for Ad Hoc Workloads

CPU
  • Set "Cost Threshold for Parallelism" = OLTP = 45 and Reporting = 25. Default is 5 which is to low
  • Set "Max Degree of Parallelism"  leave it on after you have changed the cost threshold. 
  • Set NUMA = number of physical processors, not cores, is a good place to start

Disk
  • Place TEMPDB on separate disks,
  • Set TEMPDB data and logs onto separate disks
  • Use multiple files wtih equal sizes, not equal to the number of processors
  • Use index compression
  • More disks is better but limited to the number of controllers

Statistics
  • Enable AUTO_CREATE and AUTO_UPDATE
  • Make plans to manual updates on statistics with full scans

Defragment Indexes
  • Number of pages matter,defrag below 300-500 pages
  • Cannot defrag below 8 pages
  • Defragment indexes with less then 50% fragmentation and rebuilt index if higher than 50%

DO NOT USE 
  • Disable AUTO_CLOSE
  • Disable AUTO_SHRINK
  • DO NOT use Profiler GUI, use extended events, even in SQL 2008
  • Create server side trace using T-SQL scripts. Can you use the GUI to create but execute via T-SQL

Database Design
  • Separate log and data files onto separate disks
  • Use multiple file groups even on a single disk
  • Turn off AUTO_GROW (depends). If not, use fixed growth, not percentage. Do not leave defaults in place
  • Normalize the data as it benefits performance
  • Enforce constraints, have foreign keys, primary keys, unique indexes
  • Use narrow indexes, when possible
  • Indexes work better on integers - performance better
  • Don't create too many indexes (depends)
  • Rebuilt cluster indexes 

Coding
  • Return only use data you need
  • Use stored procedures or parameterized queries
  • Avoid cursors, WHILE, LOOP
  • Quality all object names
  • Avoid using sp_* stored procedure names
  • Avoid functions on columns and LIKE command
  • SET NOCOUNT ON
  • Don't nest the views and join views to views
  • Don't use NOLOCK 
  • Avoid recompiling execution plans
  • Use table variables instead of temp tables
  • Multi statement table valued functions are very bad!

SQL Server Reporting Services Add Calculated Series to a Graph

Problem
I created a line chart in Reporting Services (SSRS). In order to analyze the data better, I’d like to add some sort of trendline to the graph, such as a weighted average for example. In Excel it is possible to add this functionality with just a few clicks. Can we achieve the same in SSRS without having to do many extra calculations?

Solution
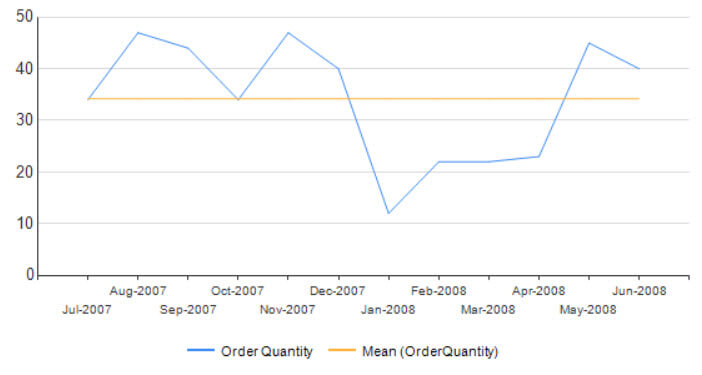
Fortunately it is pretty straight forward in SSRS to add an extra calculated series to a graph. A calculated series is a series where its data is derived from another series in the graph through a specific formula. A very simple example is the mean. Here the data is derived by aggregating the data of the base series and dividing it by the total number of data points. The result is a straight horizontal line indicating the value of the mean:
Example of a calculated series displaying the mean value
The advantage of a calculated series is that you don’t have to go through the hassle of calculating it yourself in the source query. Calculating the mean is easy enough, but there are more complex formulas. The following calculated series can be added in SSRS:
  • Mean
  • Median
  • Bollinger bands
  • Moving average
  • Exponential moving average
  • Triangular moving average
  • Weighted moving average
  • MACD
  • Detrended price oscillator
  • Envelopes
  • Performance
  • Rate of change
  • Relative strength index
  • Standard deviation
  • TRIX
Those are a lot of options, but unfortunately one of the most crucial trendlines is missing: the linear regression! This means that if you want to add a linear trendline to your graph, you still have to do the calculations yourself. This will be covered in another tip.
The official Microsoft documentation is pretty poor on this subject. The MSDN page for calculated series just lists the available options without explaining anything. There is a bit more information in an MSDN page about adding a moving average in Report Builder, but as you can guess it deals only with the moving average. Fortunately there is a lot more information on the different formulas that can be found here from this 3rd party tool. A lot of the same formulas are supported and luckily they provided an explanation.

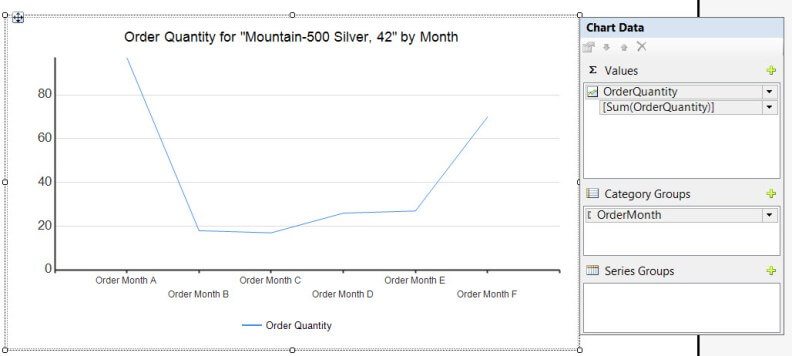
SQL Server Reporting Services Line Chart Example

To demonstrate the functionality of the calculated series, we will first create a simple line chart in SSRS. The test data is retrieved from the AdventureWorksDW2012 database with the following query:
SELECT
  [OrderQuantity] = SUM([OrderQuantity])
 ,[OrderDate]  = CONVERT(DATE,[OrderDate])
 ,OrderMonth   = LEFT(d.[EnglishMonthName],3) + '-' + CONVERT(CHAR(4),YEAR([OrderDate]))
FROM [dbo].[FactResellerSales] f
JOIN [dbo].[DimProduct]   p ON f.ProductKey = p.ProductKey
JOIN [dbo].[DimDate]   d ON f.OrderDateKey = d.DateKey 
WHERE OrderDate >= '2007-01-01' AND EnglishProductName = 'Mountain-500 Silver, 42'
GROUP BY p.[ProductKey], [OrderDate],[EnglishMonthName]
ORDER BY [OrderDate];
With this data set we will analyze the trends of the order quantity of the product ‘Mountain-500 Silver,42’. TheOrderMonth column is a user friendly representation of the year and month, and the OrderDate column is kept to ensure a correct sorting in SSRS.
Add a data source pointing to the AdventureWorksDW2012 database and add a data set with the query listed above (Learn more - Reporting Services Tutorial). Then add a line chart using the following configuration:
The starting point of our example
The OrderMonth category group is sorted by OrderDate to prevent the months from being sorted alphabetically.

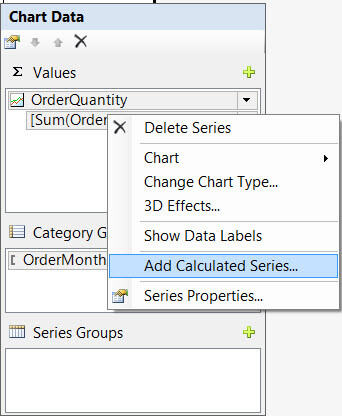
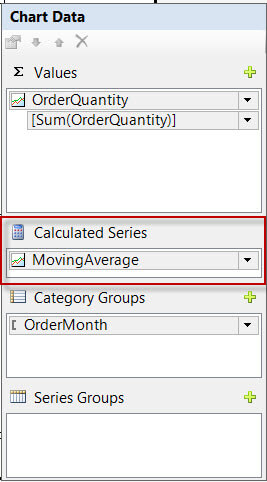
Adding a calculated series to a SSRS report

To add a new calculated series, right-click the series you want to base the calculation upon and select Add Calculated Series…
Adding a calculated series
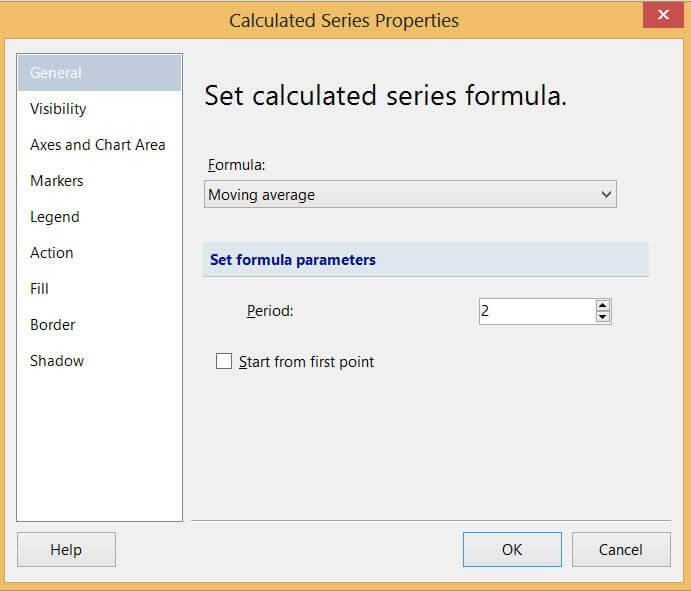
A dialog pops up, where you can select the type of formula. Some formulas have parameters and others have none at all, such as the mean and the median. The moving average takes two parameters: the number of periods to average on and if the series should start from the first point or not.
Choosing the formula and configuring the parameters
In the other panes of the dialog you can configure typical settings of a series, such as visibility, axes, borders and so on. After clicking OK, the new calculated series is added to the graph.
The new calculated series
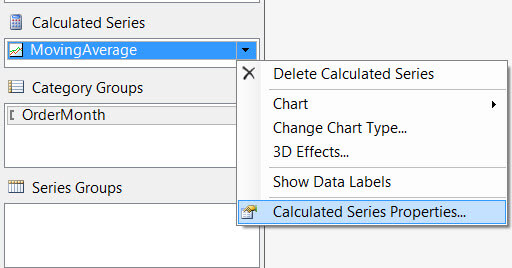
It’s a good idea to change the name of the new series in the properties pane. When clicking the down arrow and selecting Calculated Series Properties… you can go back to the same dialog as before. There you can change the parameters of the series or choose a different formula altogether.
Going to the properties...
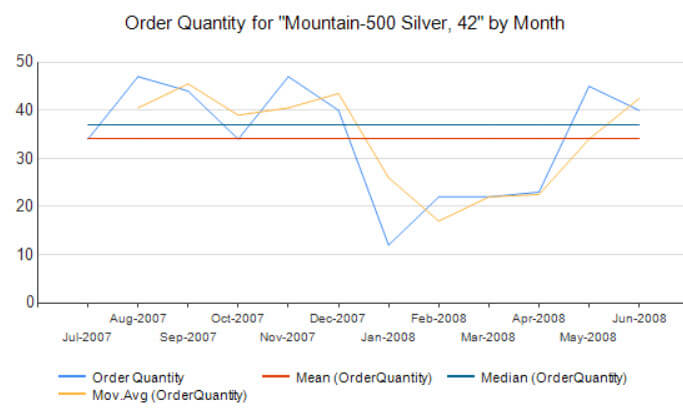
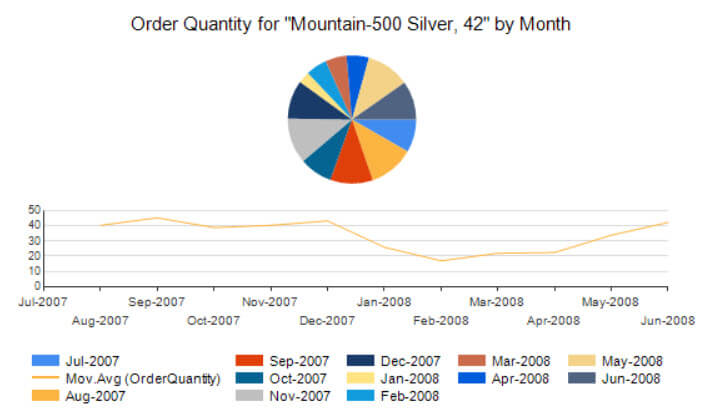
It’s possible to add multiple calculated series to one chart. In the following example, the moving average, the mean and the median have been added to our example.
Adding multiple calculates series
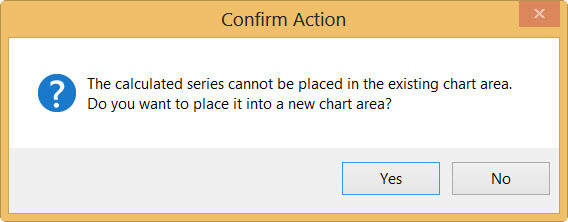
Make sure to not clutter the graph by adding too many series. It is not possible to add a calculated series based upon another calculated series. Furthermore, not all chart types in SSRS support calculated series; you can add a calculated series to a bar chart for example, but not to a pie chart. If you do try though, you are greeted with the following message:
Calculated series incompatible with graph type
If you click Yes, a new chart area is added to the chart that will contain the newly created calculated series.
I do not accept responsability for the ugliness of this chart
The pie chart defies all rules of best practices regarding data visualization, but it’s just there to show off the concept.

Conclusion

The calculated series feature in SSRS allows us to easily add trendlines to an existing graph. There are many different options, such as moving averages, mean, median and more advanced formulas such as the Bollinger bands, but somehow they forgot to add the linear regression trendline, which is really unfortunate as its use is very common. The official documentation about the different formulas is also severely lacking.

Monday 22 December 2014

SharePoint 2013: Claims Encoding

SharePoint 2013 display identity claims with the following encoding format:
·         <IdentityClaim>:0<ClaimType><ClaimValueType><AuthMode>|<OriginalIssuer (optional)>|<ClaimValue>
·         For e.g.  à i:0#.w|<Domain Name>\<userid>
Where:


  • <IdentityClaim> indicates the type of claim and is the following:
    • i” for an identity claim
    • c” for any other claim
  • <ClaimType> indicates the format for the claim value and is the following:
    • #” for a user logon name
    • .” for  an anonymous user
    • 5” for an email address
    • !” for an identity provider
    • +” for a Group security identifier (SID)
    • -“ for a role
    • %” for a farm ID
    • ?” for a name identifier
    • "\" for a private personal identifier (PPID)
    • "e" for a user principal name (UPN)
  • <ClaimValueType> indicates the type of formatting for the claim value and is the following:
    • .” for a string
    • +” for an RFC 822-formatted name
  • <AuthMode> indicates the type of authentication used to obtain the identity claim and is the following:
    • w” for Windows claims (no original issuer)
    • s” for the local SharePoint security token service (STS) (no original issuer)
    • t” for a trusted issuer
    • m” for a membership issuer
    • r” for a role provider issuer
    • f” for forms-based authentication
    • c” for a claim provider
  • <OriginalIssuer> indicates the original issuer of the claim.
  • <ClaimValueType> indicates the value of the claim in the <ClaimType> format.

Here are some examples:
Type of claim
Encoded claim
Claim encoding breakdown
Windows User
i:0#.w|<Domain name>\<UserID>
  • “i” for an identity claim
  • “#” for the user logon name  format for the claim value
  • “.” for a string
  • “w” for Windows claims
  • “<Domain name>\<UserID>” for the identity claim value (the Windows account name)
Windows Authenticated Users group
c:0!.s|windows
  • “c” for a claim other than identity
  • “!” for an identity provider
  • “.” for a string
  • “s” for the local SharePoint STS
  • “windows” for the Windows Authenticated Users group
SAML authentication (Trusted User)
i:05.t|adfs|userID@domain.com
  • “i” for an identity claim
  • “5” for the email address format for the claim value
  • “.” for a string
  • “t” for a trusted issuer
  • “adfs” identifies the original issuer of the identity claim
  • “userID@domain.com” for the identity claim value
Forms-based authentication
i:0#.f|mymembershipprovider|userid
  • “i” for an identity claim
  • “#”for the user logon name  format for the claim value
  • “.” for string
  • “f” for forms-based authentication
  • “mymembershipprovider” identifies the original issuer of the identity claim
  • “userid” for the user logon name

This change means that your userid would look something like this:

i:0#.w|<Domain Name>\<userid>

Instead of this:

<Domain Name>\<userid>
Sometimes when calling other services, you need the windows userid and not the claim userid.  So for these instances, I’ve created a few helper methods.


public const string CLAIMS_REGEX = @"(?<IdentityClaim>[ic])?:?0(?<ClaimType>[#\.5\!\+\-%?\\])(?<ClaimValueType>[\.\+])(?<AuthMode>[wstmrfc])(\|(?<OriginalIssuer>[^\|]*))?(\|(?<ClaimValue>.*))";

public static string GetAdUserIdForClaim(string login)
 {
     string userName = login;
foreach (Match m in Regex.Matches(login, CLAIMS_REGEX, RegexOptions.IgnoreCase))
{
      try
       {
       if (m.Groups["AuthMode"].Captures[0].Value.ToLower() == "w") // Base on your Requirement change authentication    mode[authentication mode:-> wstmrfc].
         {
           userName = m.Groups["ClaimValue"].Captures[0].Value;
         }
       }
      catch { }
      }
return userName;
}

Name :- Sameer Kothari
Email :- skinfotech1983@gmail.com